-
จำนวนเนื้อหา
279 -
เข้าร่วม
-
เข้ามาล่าสุด
โพสต์ ถูกโพสต์โดย NeoSeemadong
-
-
Gold
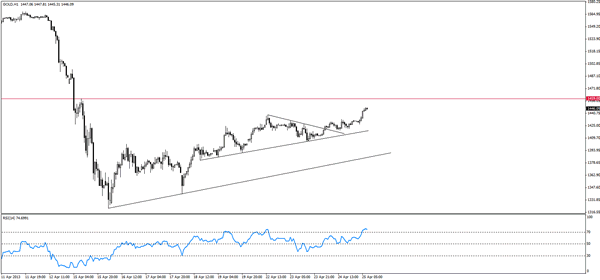
Gold continued to push higher, surpassing all of our upside targets for yesterday, and approaching the key next resistance at 1459.00 level, RSI enters overbought territory, where we expect the bullish bias to ease and probably price to resume downside attempts soon.
Support: 1438.00, 1428.00, 1417.00, 1410.00, 1403.00
Resistance: 1440.00, 1458.00, 1470.00, 1478.00, 1495.00
Recommendation Based on the charts and explanations above, we prefer to short gold below 1458.00 targeting 1440.00, and 1428.00. Stop loss with hourly closing above 1470.00
-
Technical Analysis for Precious Metals


Analysis | Commodity Technical Analysis | Written by ICN.com |
Wed Apr 24 13 02:31 ET
Gold
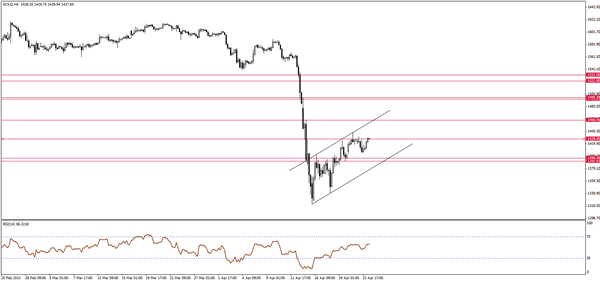
Gold maintains the structure of the bullish correctional wave, as price rebounded and attempting to settle above 1428.00 resistance, invalidating the previous bearish scenario. We will wait for further stability above 1428.00 to expect an extension of the correction, thus for now we prefer to remain on the sidelines.
Support: 1403.00 , 1390.00, 1362.00, 1340.00, 1320.00
Resistance: 1428.00, 1440.00, 1460.00, 1478.00, 1795.00
Recommendation Based on the charts and explanations above, we prefer to remain neutral
-
 1
1
-
-
Technical Analysis for Precious Metals


Analysis | Commodity Technical Analysis | Written by ICN.com |
Thu Apr 18 13 02:10 ET
Gold
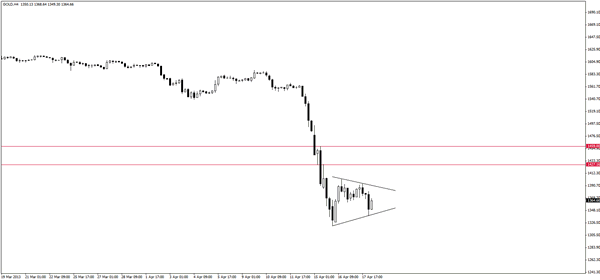
Gold fluctuated yesterday, but remained below the key short term level at 1400.00, the ongoing consolidation could be a bearish continuation pennant formation, accordingly, the bearish scenario remains likely, where only a break above 1400.00 could lead to a deeper upside correction.
Support: 1340.00, 1320.00, 1308.00, 1300.00, 1285.00
Resistance: 1390.00, 1400.00, 1425.00, 1440.00, 1458.00
Recommendation Based on the charts and explanations above, we prefer to short gold below 1380.00 targeting 1360.00, 1340.00 and 1320.00 Stop loss with hourl closing above 1397.00
-
April 18, 2013
ราคาทองคำผันผวน เนื่องจากมีการเทขาย ETPS และแรงซื้อทองคำแท่ง
ราคาทองคำแกว่งตัวขึ้นและลง หลังจากที่ปรับตัวเพิ่มขึ้นติดต่อกัน 2 วัน เนื่องจากการเทขาย ETPs ที่เทขายมากที่สุดในไตรมาสแรกและลดลง 3.5% สู่ระดับ 2,364.901 ตันในเดือนนี้ ตามข้อมูล Bloomberg ซึ่ง Goldman Sach กล่าว ว่า การถือครองอาจจะลดลงไปอีก ผสมกับสัญญาณที่ราคาใกล้จุดต่ำสุดกว่า 2 ปีได้กระตุ้นแรงซื้อทองคำแท่งเพิ่มขึ้นตั้งแต่อินเดียไปจนถึงจีน โดยปริมาณการซื้อขายทองคำในตลาดเซี่ยงไฮ้ใน 2 สัญญาเพิ่มขึ้นแตะระดับ 29.9 ตันในวันนี้ ซึ่งเป็นปริมาณที่มากที่สุด มากกว่า 29.6 ตันในวันที่ 18 ก.พ.
ที่มา : Bloomberg - Gold Swings as Investors Weigh ETPOutflows, Physical Demand, 18 April 2013, 1:54 pm
-
Technical Analysis for Precious Metals

 Analysis | Commodity Technical Analysis | Written by ICN.com | Tue Apr 16 13 01:51 ET
 Gold
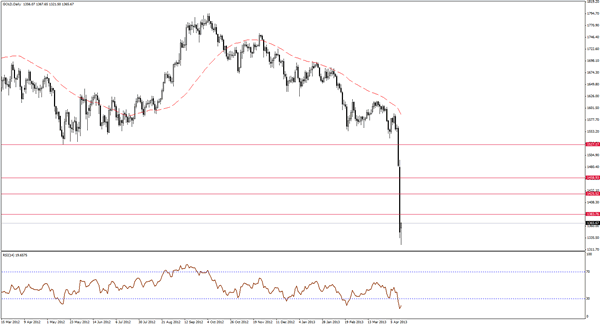
Gold witnessed the biggest one-day selloff in its history yesterday, plunging to record a low at 1320.00 level, before rebounding with the start of today’s session. The drop suggests that the sell-off could be exaggerated, and usually when we witness such sell-offs, it leads to major volatility where correctional bounces can be strong and lengthy. Accordingly, we will look to short the metal but at a higher price
Support: 1320.00, 1308.00, 1300.00, 1285.00, 1260.00
Resistance: 1385.00, 1400.00, 1425.00, 1440.00, 1458.00
Recommendation Based on the charts and explanations above, we prefer to short gold around 1385.00, targeting 1350.00 and 1325.00 Stop loss above 1400.00
-
 1
1
-
-
Technical Analysis for Precious Metals

 Analysis | Commodity Technical Analysis | Written by ICN.com | Tue Apr 16 13 01:51 ET
 Gold
Gold witnessed the biggest one-day selloff in its history yesterday, plunging to record a low at 1320.00 level, before rebounding with the start of today’s session. The drop suggests that the sell-off could be exaggerated, and usually when we witness such sell-offs, it leads to major volatility where correctional bounces can be strong and lengthy. Accordingly, we will look to short the metal but at a higher price
Support: 1320.00, 1308.00, 1300.00, 1285.00, 1260.00
Resistance: 1385.00, 1400.00, 1425.00, 1440.00, 1458.00
Recommendation Based on the charts and explanations above, we prefer to short gold around 1385.00, targeting 1350.00 and 1325.00 Stop loss above 1400.00
-
Analysis | Commodity Technical Analysis | Written by ICN.com |
Fri Nov 02 12 02:42 ET
Gold
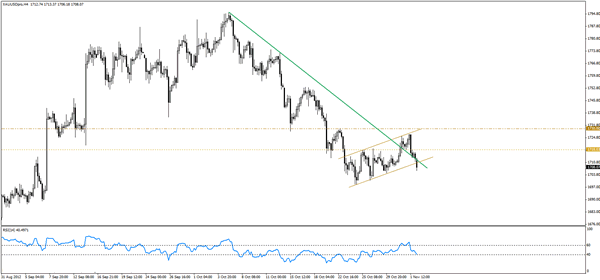
Our suggested bullish scenario for yesterday failed just below 1730.00 level, as the price retreated after testing the resistance of the flag pattern, to head sharply lower, and breach the support of the flag. The breakout of the flag suggests a continuation of the bearish wave, and accordingly, we reverses our view to bearish over intraday basis .
The trading range for today is expected among the key support at 1685.00 and key resistance now at 1730.00.
The short term trend is to the upside targeting 1945.00 per ounce as far as areas of 1520.00 remain intact with a weekly closing.
Support: 1705.00, 1700.00, 1688.00, 1675.00, 1665.00
Resistance: 1715.00, 1725.00, 1730.00, 1740.00, 1750.00
Recommendation Based on the charts and explanations above, we recommend selling gold around 1714.00, targeting 1700.00 and 1685.00.Stop loss above 1726.00
-
เจอบทวิเเคระกูรูนอกนี้ กูไม่รู้เลย เพราะอ่านไม่ออก
 :_01
:_01  :_01
:_01เจอบทวิเเคระกูรูนอกนี้ กูไม่รู้เลย เพราะอ่านไม่ออก
 :_01
:_01  :_01
:_01ขอโทษนะครับ ผมผิดเอง ทั่ไม่ได้แปลให้ด้วย
-
Technical Analysis for Precious Metals

 Analysis | Commodity Technical Analysis | Written by ICN.com | Wed Sep 19 12 02:16 ET
 Gold
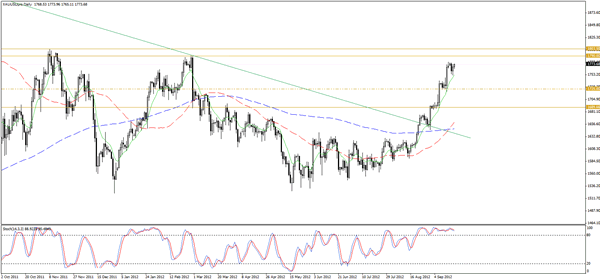
After testing areas around 1750.00 at the 10-day Exponential Moving Average, the metal rebounded approaching the recent highs at 1778.00. The price may have completed a minor correction and attempting to resume the bullish wave towards the next potential resistance areas near 1800.00. In general, the bullish picture is still dominant , and will remain so as long as 1750.00 level is holding.
The trading range for today is expected among the key support at 1740.00 and key resistance now at 1805.00.
The short term trend is to the upside targeting 1945.00 per ounce as far as areas of 1520.00 remain intact with a weekly closing.
Support: 1750.00, 1740.00, 1725.00, 1713.00, 1700.00
Resistance: 1775.00, 1790.00, 1803.00, 1816.00, 1830.00
Recommendation Based on the charts and explanations above, we recommend buying gold above 1750.00 targeting 1775.00 and 1800.00. Stop loss four-hour closing below 1725.00
-
 1
1
-
-
Technical Analysis for Precious Metals /images/M_images/printButton.png /images/M_images/emailButton.png Analysis | Commodity Technical Analysis | Written by ICN.com | Wed Jul 18 12 02:05 ET
Gold
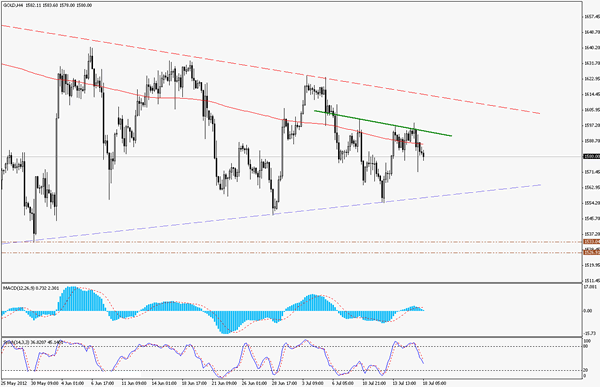
Gold fluctuated heavily yesterday, where it failed to surpass the neckline of the potential inverted head and shoulders pattern, to reverse and price has settled back below the 50-days SMA, while momentum has turned to be slightly bearish. At the same time, price is trading at the middle of the symmetrical triangle consolidation pattern. Accordingly, we prefer to be neutral at the current levels.
The trading range for today is expected among the key support at 1520.00 and key resistance now at 1640.0.
The short term trend is to the upside targeting 1945.00 per ounce as far as areas of 1520.00 remain intact with a weekly closing.
Support: 1575.00, 1564.00, 1555.00, 1547.00, 1533.00
Resistance: 1583.00, 1600.00, 1610.00, 1616.00, 1625.00
Recommendation Based on the charts and explanations above we recommend staying aside awaiting further confirmation.
-
Technical Analysis for Precious Metals

 Analysis | Commodity Technical Analysis | Written by ICN.com | Wed Jun 06 12 02:10 ET
 Gold
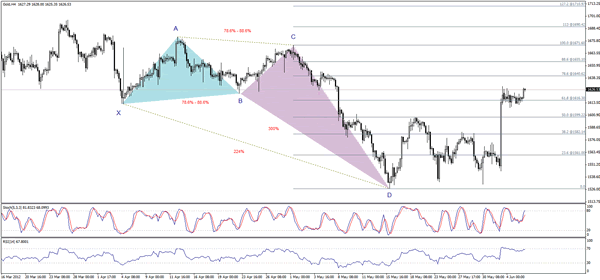
Gold inclined today in line with our previous expectations, reaching the first target after confirming stability above 61.8% Fibonacci correction of the CD leg of the bullish deep crab harmonic pattern. Harmonically, consolidation above the second target at 1616.00 suggests the continuity of the upside move , targeting mainly 1640.00, which represents the first extended target. The upside move might extend further towards 88.6% Fibonacci correction at 1655.00. Consolidation above 1599.00 is necessary for our positive outlook to prevail, while stability above 1616.00 strengthens the suggested bullishness.
The trading range for today is among the key support at 1599.00 and key resistance now at 1655.00.
The short term trend is to the upside targeting 1945.00 per ounce as far as areas of 1475.00 remain intact with a weekly closing.
Support: 1624.00, 1620.00, 1616.00, 1608.00, 1604.00
Resistance: 1627.00, 1633.00, 1640.00, 1645.00, 1650.00
Recommendation Based on the charts and explanations above our opinion is buying gold around 1620.00, targeting 1633.00, 1640.00 and 1650.00 and stop loss below 1604.00 might be appropriate.
-
Technical Analysis for Precious Metals Analysis | Commodity Technical Analysis | Written by ecPulse.com | Wed Mar 28 12 03:04 ET
Gold
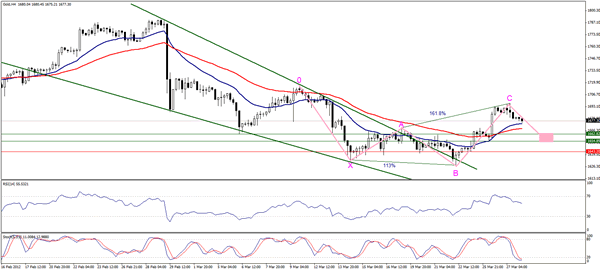
Gold declined due to the overbought signs seen on momentum indicators, but this decline helped us in recognizing an intraday harmonic structure that might be a bullish 0-5 harmonic pattern. This pattern supports the classic pattern mentioned in our weekly report. Any trading above 1654.00 suggests the return of the upside significantly, but at the same time, we expect the downside correction to extend slightly before the suggested upside move. A breach of 1643.00 should negate our positive scenario.
The trading range for today is among the key support at 1624.00 and key resistance now at 1709.00.
The short-term trend is to the upside with steady weekly closing above 1475.00 targeting 1945.00.
Support: 1673.00, 1666.00, 1662.00, 1656.00, 1650.00
Resistance: 1681.00, 1690.00, 1694.00, 1700.00, 1703.00
Recommendation Based on the charts and explanations above our opinion is buying gold around 1666.00, targeting 1694.00, 1709.00 and 1728.00 and stop loss with 4-hour closing below 1643.00 might be appropriate.
-
Technical Analysis for Precious Metals


Analysis | Commodity Technical Analysis | Written by ecPulse.com |
Fri Feb 17 12 03:19 ET
Gold
The bearishness stopped again in areas around the support level at 1706.00 and then gold rebounded to the upside. Currently, the metal approaches the critical resistance of the downside movement shown in red, while Stochastic is within overbought areas. Therefore, we expect another bearish attempt today. But, stability again below EMA 50 is necessary to support out outlook. A breach of 1750.00-54.00 is sufficient to negate our intraday expectations.
The trading range for today is among the key support at 1670.00 and key resistance now at 1794.00.
The short-term trend is to the upside with steady weekly closing above 1475.00 targeting 1945.00.
Support: 1724.00, 1718.00, 1711.00, 1706.00, 1700.00
Resistance: 1735.00, 1742.00, 1750.00, 1754.00, 1763.00
Recommendation Based on the charts and explanations above, our opinion is selling gold around 1735.00, and take profit in stages at (1706.00 and 1687.00) and stop loss with 4-hour closing above 1754.00 might be appropriate. In case the metal reached our stop loss point, our opinion is buying gold around 1754.00 and take profit in stages at 1763.00, 1772.00 and 1794.00 and stop loss with 4-hour closing below 1734.00 might be appropriate
-
Technical Analysis for Precious Metals
Analysis | Commodity Technical Analysis |
Written by ecPulse.com | Wed Feb 15 12 03:17
Gold
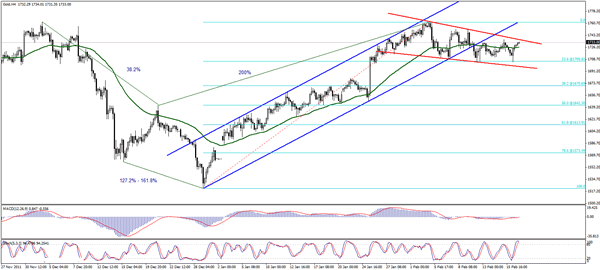
Gold remained within narrow levels yesterday and continues today to trade between the descending support and resistance levels shown above in red. In fact, a breach of the descending main resistance could form a bullish continuation pattern. But at the same time, trading outside the ascending channel contradicts this outlook. We expect the metal to provide another bearish attempt, but consolidation below 1763.00 is required; however, over intraday basis we prefer consolidation below 1750.00.
The trading range for today is among the key support at 1670.00 and key resistance now at 1794.00.
The short-term trend is to the upside with steady weekly closing above 1475.00 targeting 1945.00.
Support: 1724.00, 1718.00, 1711.00, 1706.00, 1700.00
Resistance: 1735.00, 1742.00, 1750.00, 1754.00, 1763.00
Recommendation Based on the charts and explanations above, our opinion is selling gold below 1735.00, and take profit in stages at (1706.00 and 1687.00) and stop loss with 4-hour closing above 1750.00 might be appropriate. In case the metal reached our stop loss point, our opinion is buying gold around 1750.00 and take profit in stages at 1763.00, 1772.00 and 1794.00 and stop loss with 4-hour closing below 1724.00 might be appropriate
-
Technical Analysis for Precious Metals
| Written by ecPulse.com | Mon Feb 13 12 04:00 ET
Gold
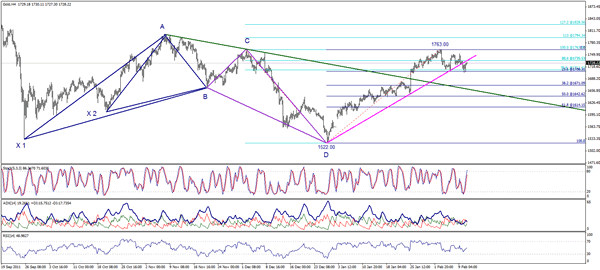
The metal breached the ascending main support level shown above in pink, but 23.6% Fibonacci correction of the upside move, which started at the bottom of 1522.00 and ended at the top of 1763.00, was able to stop the bearishness. Gold returned to trade again within critical levels, where trading below © point of the double harmonic stature and also below 88.6% Fibonacci correction of the CD leg at 1735.00 suggests retesting the support level shown in green, supported by stability below the ascending main support. But at the same time, the metal failed to settle below 1706.00. Therefore, we remain neutral now, awaiting the metal to confirm the breach of 1706.00 with 4-hour closing below it.
The trading range for this week is among the key support at 1640.00 and key resistance now at 1794.00.
The short-term trend is to the upside with steady weekly closing above 1475.00 targeting 1945.00.
Support: 1724.00, 1711.00, 1706.00, 1702.00, 1670.00
Resistance: 1735.00, 1742.00, 1750.00, 1754.00, 1763.00
Recommendation Based on the charts and explanations above, we remain neutral awaiting more confirmations
-
Technical Analysis for Precious Metals

 Analysis | Commodity Technical Analysis | Written by ecPulse.com | Tue Feb 07 12 03:11 ET
 Gold
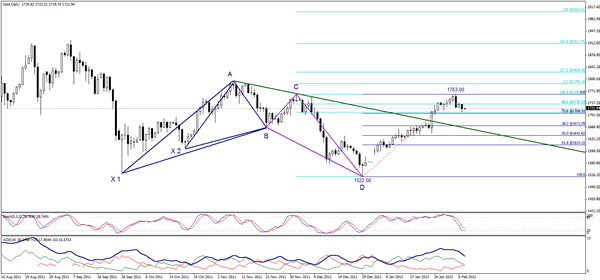
The metal declined to reach the level of 1711.00, while Stochastic is almost within oversold areas, in the time the negative crossover failed on ADX, which threatens the suggested downside movement. But, consolidation below 1735.00 suggests that the downside movement could extend further to breach the level of 1711.00 and then 1706.00 and then moving towards 38.2% and 50% Fibonacci corrections of the upside wave, which started at 1522.00 and ended at 1763.00.
The trading range for today is among the key support at 1670.00and key resistance now at 1763.00.
The short-term trend is to the upside with steady weekly closing above 1475.00 targeting 1945.00.
Support: 1718.00, 1711.00, 1706.00, 1702.00, 1694.00
Resistance: 1724.00, 1735.00, 1742.00, 1750.00, 1754.00
Recommendation Based on the charts and explanations above, our opinion is selling gold around 1735.00, and take profit in stages at (1706.00 and 1670.00) and stop loss with 4-hour closing above 1763.00 might be appropriate
-
 1
1
-
-
http://www.prachachat.net/news_detail.php?newsid=1328072679&grpid=&catid=09&subcatid=0900
กูรูแห่เชียร์ทองขึ้น2,000ดอลล์ เล่นข่าวเงินเฟ้อพุ่ง-เฟดออกQE3
กูรูทองคำ คงเป้าราคาทองขาขึ้นมีโอกาสแตะ 2,000 เหรียญต่อออนซ์ จับตาราคาน้ำมันพุ่งหนุนเงินเฟ้อสูง และ QE 3 หนุนราคาทองแรงไตรมาส 4 แนะแบ่งลงทุนถือยาว และทำกำไรระยะสั้น
นายคมสันต์ ปรมาภูติ รองผู้อำนวยการฝ่ายกลยุทธ์การลงทุน บริษัท หลักทรัพย์ (บล.) บัวหลวง กล่าวในงานสัมมนา "ทองคำพื้นฐานหรือฟองสบู่" ที่ตลาดหลักทรัพย์แห่งประเทศไทยว่า ทิศทางราคาทองคำหลังจากนี้จะยังคงมีแนวโน้มเป็นขาขึ้น เพียงแต่ยังไม่ใช่ระดับที่เป็นฟองสบู่ เพราะยังมีปัจจัยพื้นฐานรองรับ ซึ่งบริษัทประเมินว่ามีโอกาสที่จะแกว่งตัวขึ้นไปสูงถึง 2,000 เหรียญสหรัฐต่อออนซ์ แต่หากประเมินในระดับปกติ น่าจะอยู่ที่ราว 1,600 เหรียญสหรัฐต่อออนซ์
อย่างไรก็ตาม ทิศทางการแกว่งตัวของราคาทองคำปีนี้ น่าจะเริ่มลดลงในไตรมาส 2 ซึ่งเป็นช่วง low season แต่ก็ถือเป็นจังหวะที่นักลงทุนสามารถเข้าช้อนซื้อได้ เพราะมั่นใจว่าไตรมาส 3 ราคาทองคำจะเริ่มฟื้นตัว เนื่องจากเป็นช่วงที่หลายคนคาดการณ์ว่าจะมีการออกนโยบายการเงินผ่อนคลายเชิง ปริมาณ (QE) ครั้งที่ 3 ของสหรัฐ เข้ามากระตุ้นเศรษฐกิจ เพื่อเรียกคะแนนเสียงก่อนที่จะมีการจัดเลือกตั้งทั่วไปในไตรมาส 4
ประกอบ กับในช่วงไตรมาส 4 เป็นช่วงที่ขาขึ้นจากความต้องการทองคำ เพราะมีการซื้อเพื่อนำไปเป็นของขวัญในเทศกาลต่าง ๆ จึงทำให้น่าจะมีแรงซื้อทยอยเข้ามาให้เห็นตั้งแต่ไตรมาส 3
นางสาวฐิ ภา นววัฒนทรัพย์ ประธานเจ้าหน้าที่บริหาร บริษัท วายแอลจี บูลเลี่ยน แอนด์ ฟิวเจอร์ส จำกัด กล่าวว่า ทิศทางการแกว่งตัวของราคาทองคำในปีนี้จะค่อนข้างผันผวนใกล้เคียงกับปีก่อน แต่ยังเป็นทิศทางขาขึ้น โดยบริษัทประเมินจุดต่ำสุดราคาทองคำไว้ที่ระดับ 1,480 เหรียญสหรัฐต่อออนซ์ และจุดสูงสุดที่ระดับ 2,000 เหรียญสหรัฐตอ ออนซ
แต่นักลงทุนต้องใช้ความระมัดระวังในการซื้อขายพอสมควร เนื่องจากหากราคาทองปรับตัวขึ้นไปถึงระดับ 1,900 เหรียญสหรัฐ จะมีแรงเทขายทำกำไรออกมา กดดันให้ราคาทองปรับตัวลดลงได้
ดังนั้น เพื่อป้องกันการขาดทุนจากราคาทองที่มีโอกาสปรับตัวลดลง แนะนำให้นักลงทุนจับตาปัจจัยสำคัญต่าง ๆ เช่น ค่าเงินดอลลาร์ ซึ่งหากแข็งค่าขึ้นจะมีผลให้ราคาทองคำแพงขึ้น และราคาน้ำมันดิบ ซึ่งหากปรับตัวเพิ่มขึ้นจะก่อให้เกิดเงินเฟ้อ จนมีผลทำให้ราคาทองคำแพงขึ้นเช่นกัน เนื่องจาก นักลงทุนจะเข้ามาซื้อเพื่อป้องกันความเสี่ยง รวมถึงแนะนำให้จับตาค่าเงินบาท เพราะความเปลี่ยนแปลงทุก 10 สตางค์ จะทำให้ราคาทองคำเปลี่ยนแปลงขึ้นหรือลงราว 80 บาท ในทิศทางเดียวกัน
นาย วศิน วัฒนวรกิจกุล กรรมการ ผู้จัดการ กลุ่มธุรกิจกองทุนรวม บริษัทหลักทรัพย์จัดการกองทุน (บลจ.) บัวหลวง กล่าวว่า การลงทุนในทองคำช่วงนี้ ยังสามารถสร้างโอกาสจากการทำกำไรในการซื้อขายระยะสั้นและการถือครองระยะยาว ได้ รวมถึงหากมีทองคำไว้ในพอร์ต จะช่วยลดความเสี่ยงจากการลงทุนโดยรวมได้ด้วย เนื่องจากราคาทองคำไม่สัมพันธ์กับหุ้นและตราสารหนี้
ทั้งนี้หากนัก ลงทุนที่เน้นลงทุนทองคำเป็นส่วนมาก แนะนำให้บริหารความเสี่ยงการลงทุนทองคำทั้งหมด โดยการใช้วิธีการแบ่งพอร์ตออกเป็น 3 ส่วน ได้แก่ ส่วนที่ 1 ซื้อลงทุนทันที และถือไว้ในระยะยาว ส่วนที่ 2 ซื้อเพื่อใช้เก็งกำไรระยะสั้น ขายออกทันทีเมื่อให้รับผลตอบแทนในระดับที่เหมาะสม และส่วนที่ 3 ทยอยลงทุนเมื่อราคาปรับตัวลดลง ซึ่งกลยุทธ์นี้จะทำให้นักลงทุนไม่ต้องกังวลกับความเสี่ยงจากการลงทุนทองคำ ที่มีความผันผวน
-
วิเคราะห์ราคาทางเทคนิคช่วงเย็น โดย นพ.กฤชรัตน์ หิรัณยศิริ ประจาวันศุกร์ที่ 27 มกราคม พ.ศ. 2555
Gold – ราคาทองคาในระหว่างวันเคลื่อนไหว Side Way Up ในกรอบ 1,715 -1,725 $ โดยราคาทองคากลับเข้าภาวะพักฐานในระยะสั้นๆ และมีแรงเทขายทากาไร ภาพรวมทั่วไปของราคาทองคายังเป็นแนวโน้มขาขึ้น ในคืนนี้จับตามอง World Economic Forum ล่าสุดในกรุงดาวอส ประเทศสวิสเซอร์แลนด์ ซึ่งรัฐมนตรีคลังยุโรปจะออกมาแถลงการณ์ในค่าคืนวันนี้ และ ประธานอีซีบีที่จะออกมากล่าวประมาณเวลา 20.30 น. อีกทั้ง GDP ของสหรัฐที่คาดการณ์ว่าจะปรับตัวดีขึ้น ราคาทองคามีแนวต้านสาคัญที่ระดับ 1,750 เหรียญ และแนวรับที่ระดับ 1,690 เหรียญ คาดว่าน่าจะมีการแกว่งตัว ยังแนะนาในนักลงทุนเข้าซื้อเมื่อราคาอ่อนตัว และขายทากาไรเมื่อชนแนวต้าน
3 ส่วน ได้แก่ GOLD ANALYSIS, GOLD RECAP และ GOLD MARKET
วิเคราะห์ราคาทางเทคนิคช่วงเย็น โดย นพ.กฤชรัตน์ หิรัณยศิริ ประจาวันศุกร์ที่ 27 มกราคม พ.ศ
. 2555
-
 1
1
-
-
Technical Analysis for Precious Metals
Analysis | Commodity Technical Analysis | Written by ecPulse.com |
Fri Jan 27 12 03:52 ET
Gold
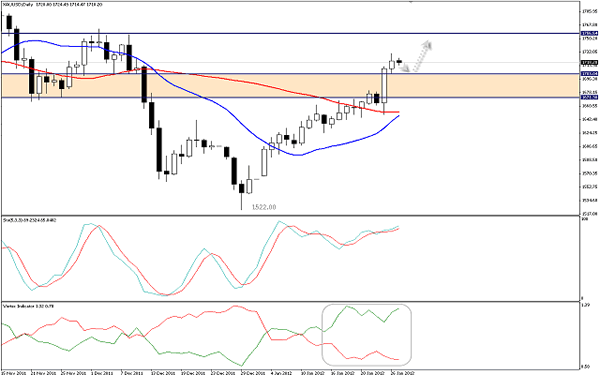
In line with yesterday's proposed bullish scenario, the metal inclined touching one of the most important barriers at 1730.00 as seen on the provided daily chart. Gold may retest the previous broken resistance -turned into support- around 1702.00 before moving higher once more classically targeting 1756.00. Stochastic and Vortex reinforce the suggested bullish scenario but breaching through 1665.00 will negate the bullishness.
The trading range for today is among the key support at 1665.00 and key resistance now at 1764.00.
The general trend over the short term basis is to the upside targeting 1945.00 per ounce as far as areas of 1475.00 remain intact with weekly closing.
Support: 1713.00, 1702.00, 1687.00, 1673.00, 1665.00
Resistance: 1720.00, 1726.00, 1744.00, 1756.00, 1764.00
Recommendation Based on the charts and explanations above our opinion is, buying gold around 1702.00 targeting 1756.00 and stop loss below 1665.00 might be appropriate.
-
 1
1
-
-
Analysis | Commodity Technical Analysis | Written by ecPulse.com |
Fri Jan 20 12 04:57 ET
Gold
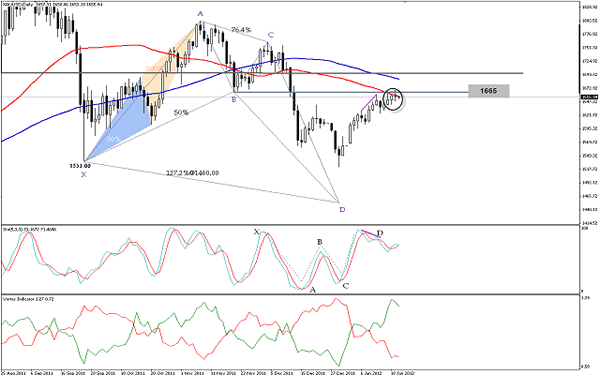
Gold has closed negatively below SMA 50 and below the initial resistance level around 1665.00 where the B point of the potential harmonic Crab pattern exists as seen on the provided daily graph. At the same time, Stochastic started to show some kind of weakness but we will continue staying aside until the metal penetrates 1628.00 to prove the effect of the harmonic pattern. Of note, breaching through 1665.00 with a daily closing will negate the harmonic probability of resuming the downside journey of the CD leg.
The trading range for today is among the key support at 1607.00 and key resistance now at 1703.00.
The general trend over the short term basis is to the upside targeting 1945.00 per ounce as far as areas of 1475.00 remain intact with weekly closing.
Support: 1650.00, 1645.00, 1635.00, 1628.00, 1615.00
Resistance: 1665.00, 1669.00, 1673.00, 1687.00, 1695.00
Recommendation Based on the charts and explanations above our opinion is, staying aside as risk versus reward ratio is too high today.
-
 1
1
-
-
-
Technical Analysis for Precious Metals Analysis | Commodity Technical Analysis | Written by ecPulse.com | Tue Jan 17 12 03:19 ET
Gold
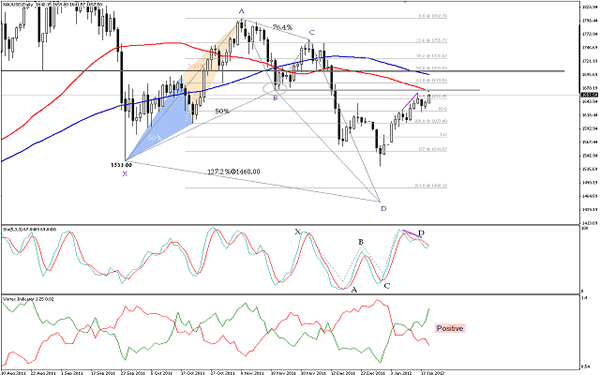
The metal has moved mildly to the upside during the Asian session but trading continued below SMA 50 and below the initial resistance of 1665.00 where B point of the suggested Crab pattern exists. In the interim, SMA 50 -colored in red- is covering the movements as well but the positivity on Vortex in addition to the shaky sign of Stochastic are reasons that force us to stay aside today; noting that a daily closing above 1665.00 will damage our harmonic structure. On the downside, clearing 1628.00 will activate the bearishness of the CD leg.
The trading range for today is among the key support at 1607.00 and key resistance now at 1703.00.
The general trend over the short term basis is to the upside, targeting $ 1945.00 per ounce as far as areas of 1475.00 remain intact with weekly closing.
Support: 1650.00, 1645.00, 1635.00, 1628.00, 1615.00
Resistance: 1665.00, 1673.00, 1687.00, 1695.00, 1703.00
Recommendation Based on the charts and explanations above our opinion is, staying aside as risk versus reward ratio is too high today.
-
 1
1
-
-
Technical Analysis for Precious Metals


Analysis | Commodity Technical Analysis | Written by ecPulse.com |
Thu Dec 22 11 03:43 ET
Gold
Yesterday's violent declines from 1640.00 zones have proved our point of view where we mentioned that the risk versus reward ratio was very high. We recommend reviewing the previous report for more details about the recently established harmonic structure. Back to our main bearish harmonic AB=CD pattern which continues affecting the metal with stability below 76.4% Fibonacci of its CD leg. Hence, resuming the southern trip to reach more extended technical targets is still favored over intraday basis. The four-hour candlesticks formations reinforce our negative technical prospects, while breaching the initial support of 1603.00 will confirm the bearishness.
The trading range for today is among the key support at 1533.00 and key resistance now at 1653.00.
The general trend over the short term basis is to the upside, targeting $ 1945.00 per ounce as far as areas of 1475.00 remain intact with weekly closing.
Support: 1603.00, 1590.00, 1582.00, 1575.00, 1559.00
Resistance: 1615.00, 1620.00, 1628.00, 1635.00, 1645.00
Recommendation Based on the charts and explanations above our opinion is, selling gold below 1603.00 targeting 1540.00 and stop loss above 1645.00 might be appropriate.
-
Technical Analysis for Precious Metals
Analysis | Commodity Technical Analysis | Written by ecPulse.com | Wed Dec 21 11 03:06 ET
Gold
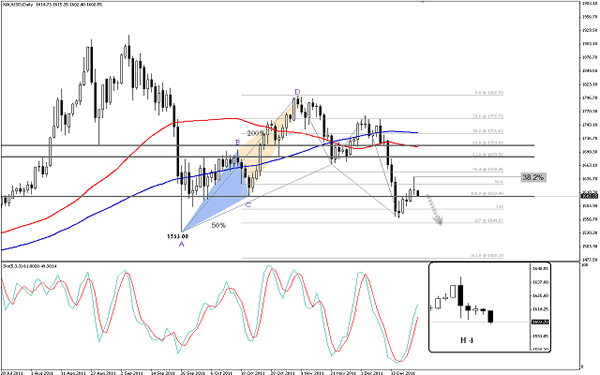
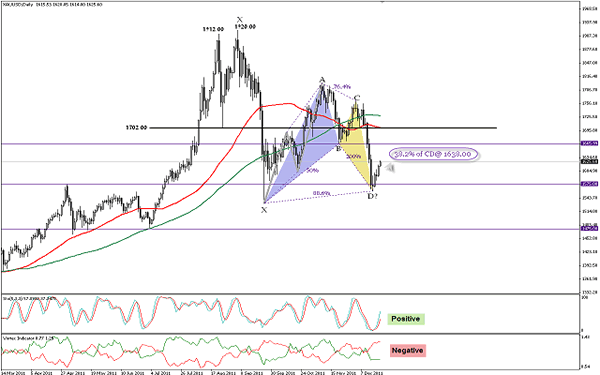
The sharp bounce from 1560.00 continued while we have been able to catch a potential bullish harmonica pattern connected by the above seen Fibonacci rhythmic. The metal is presently approaching the first technical objective of the pattern at 38.2% Fibonacci retracement of CD leg. Assessing indicators, Stochastic continued offering positive sign; whilst Vortex contradicts it presenting bearish sign. Since risk versus reward ratio is high, we will stay aside over intraday basis. Breaching through 1638.00 with a daily closing will bring more bullishness.
The trading range for today is among the key support at 1575.00 and key resistance now at 1673.00.
The general trend over the short term basis is to the upside, targeting $ 1945.00 per ounce as far as areas of 1475.00 remain intact with weekly closing.
Support: 1620.00, 1615.00, 1607.00, 1603.00, 1590.00
Resistance: 1628.00, 1635.00, 1645.00, 1653.00, 1665.00
Recommendation Based on the charts and explanations above our opinion is, staying aside since risk versus reward ratio is too high for intraday trader



บทวิเคราะห์ของกูรูนอก
ใน บทวิเคราะห์ราคาทองคำ
ได้โพสต์เมื่อ · ตอบกลับรายงาน
Technical Analysis for Precious Metals

Analysis | Commodity Technical Analysis | Written by ICN.com |
Tue May 21 13 02:17 ET
Gold
Gold jumped yesterday, forming a major bullish engulfing candle, invalidating our bearish scenario and indicating an upside rebound, a retest of the minor descending trend line shown on the daily chart above seems imminent, a break above the trend line shall clear the way towards another test of 1478.00 resistance area. We would like to see price hold above 1390.00 for at least few hours to expect an extension of the rebound.
Support: 1391.00, 1385.00, 1363.00, 1357.00, 1340.00
Resistance: 1405.00, 1418.00, 1425.00, 1445.00, 1455.00
Recommendation Based on the charts and explanations above, we prefer to remain on the sidelines awaiting confirmation